CMU 15-112: Fundamentals of Programming and Computer Science
Class Notes: Graphics in Tkinter
Learning Goal: write code to draw basic graphics using the Tkinter library. In particular:
- Draw rectangles, ovals, polygons, lines, and text with the Tkinter library
- Use math and problem solving to reconstruct images shown in their final state
- Use creativity to design graphics based on open-ended prompts.
Note: We will only run graphics in Standard Python. These examples will not run in Brython.
The standard Python documentation for tkinter can be hard to read. You can find our preferred documentation here.
- Create an Empty Canvas
- Canvas Coordinates
- Draw a Rectangle
- Check 2.5
- Graphics Parameters
- Draw Other Shapes and Text
- Check 2.6
- Draw Custom Colors
- Draw Centered Shapes
- Graphics Helper Functions
- Resizing Text
- Check 2.7
- Drawing Circular Patterns with Trigonometry
- Example: Clocks!
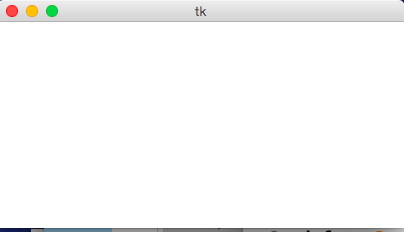
- Create an Empty Canvas
from tkinter import * def draw(canvas, width, height): pass # replace with your drawing code! def runDrawing(width=300, height=300): root = Tk() root.resizable(width=False, height=False) # prevents resizing window canvas = Canvas(root, width=width, height=height) canvas.configure(bd=0, highlightthickness=0) canvas.pack() draw(canvas, width, height) root.mainloop() print("bye!") runDrawing(400, 200)Result:
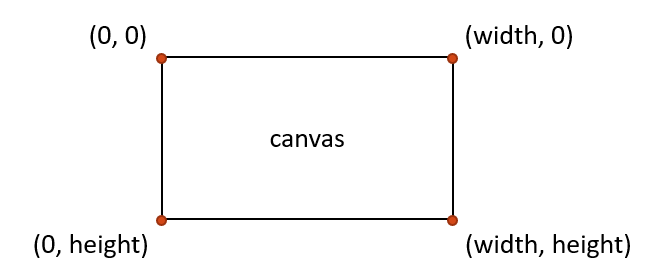
- Canvas Coordinates We refer to pixels on the canvas in terms of x,y coordinates. This lets us specify where to draw objects. However, the graphics canvas has one major difference from math coordinate planes: the y axis grows down instead of up. The (0, 0) point is therefore at the top left corner of the canvas.
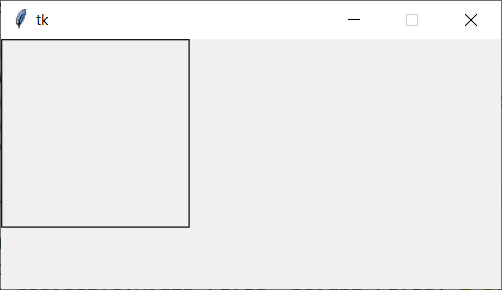
- Draw a Rectangle
def draw(canvas, width, height): # The first four parameters are the upper-left (x,y) # and the lower-right (x,y) of the rectangle canvas.create_rectangle(0,0,150,150)Result:
- Check 2.5
- Graphics Parameters
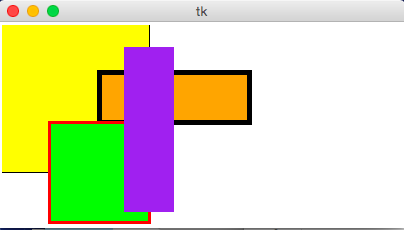
def draw(canvas, width, height): # most graphics functions allow you to use optional parameters # to change the appearance of the object. These are written with the code # paramName=paramValue # after the core parameters in the code # fill changes the internal color of the shape canvas.create_rectangle( 0, 0, 150, 150, fill="yellow") # width changes the size of the border canvas.create_rectangle(100, 50, 250, 100, fill="orange", width=5) # outline changes the color of the border canvas.create_rectangle( 50, 100, 150, 200, fill="green", outline="red", width=3) # width=0 removes the border entirely canvas.create_rectangle(125, 25, 175, 190, fill="purple", width=0)Result:
- Draw Other Shapes and Text
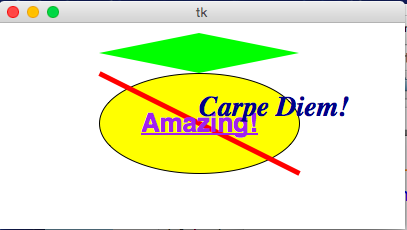
def draw(canvas, width, height): # ovals provide the coordinates of the bounding box canvas.create_oval(100, 50, 300, 150, fill="yellow") # polygons and lines provide the (x,y) coordinates of each point # polygons must have 3+ points; lines must have 2+ canvas.create_polygon(100,30,200,50,300,30,200,10, fill="green") canvas.create_line(100, 50, 300, 150, fill="red", width=5) # text provides a single (x,y) point, then anchors the text there # text also requires the text, and can have a font canvas.create_text(200, 100, text="Amazing!", fill="purple", font="Helvetica 26 bold underline") canvas.create_text(200, 100, text="Carpe Diem!", anchor="sw", fill="darkBlue", font="Times 28 bold italic")Result:
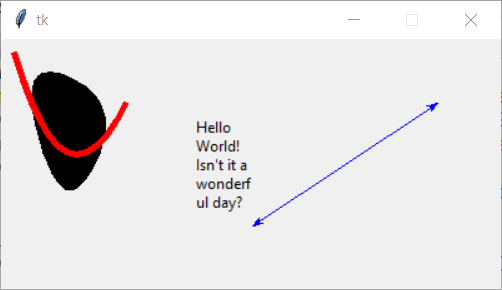
Other shapes can have optional parameters too. You don't need to know these, but they can be fun to use!def draw(canvas, width, height): # smooth lets you make interesting curvy shapes using polygons or lines canvas.create_polygon(10, 10, 50, 150, 100, 50, smooth=1) # but if you want to draw an arc, use create_arc canvas.create_line(10, 10, 50, 150, 100, 50, width=5, fill="red", smooth=1) # lines can also add arrows to the end canvas.create_line(350, 50, 200, 150, arrow=BOTH, fill="blue") # by default, text is drawn all on one line # using width breaks the text into multiple lines at that width canvas.create_text(200, 100, text="Hello World! Isn't it a wonderful day?", width=50, anchor="e")Result:
- Check 2.6
- Draw Custom Colors
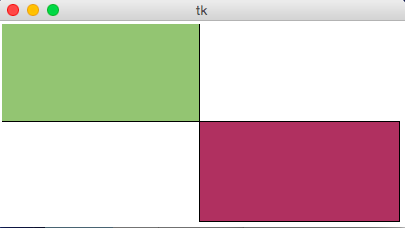
def rgbString(red, green, blue): # Don't worry about how this code works yet. return "#%02x%02x%02x" % (red, green, blue) def draw(canvas, width, height): pistachio = rgbString(147, 197, 114) maroon = rgbString(176, 48, 96) canvas.create_rectangle(0, 0, width/2, height/2, fill=pistachio) canvas.create_rectangle(width/2, height/2, width, height, fill=maroon)Result:
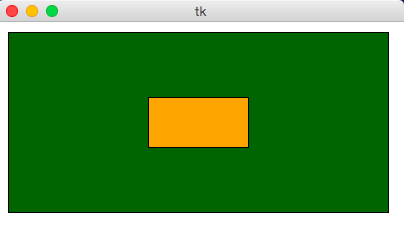
- Draw Centered Shapes
def draw(canvas, width, height): margin = 10 # Approach #1: Add margin to top/left, subtract margin from bottom/right: canvas.create_rectangle(margin, margin, width-margin, height-margin, fill="darkGreen") # Approach #2: add/subtract width/height from center (cx, cy) (cx, cy) = (width/2, height/2) (rectWidth, rectHeight) = (width/4, height/4) canvas.create_rectangle(cx - rectWidth/2, cy - rectHeight/2, cx + rectWidth/2, cy + rectHeight/2, fill="orange")Result:
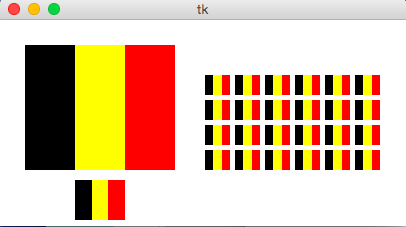
- Graphics Helper Functions
# In most cases, we don't want to draw images based on arbitrary numbers- # we want to compute positions based on the size of the window def drawBelgianFlag(canvas, x0, y0, x1, y1): # draw a Belgian flag in the area bounded by (x0,y0) in # the top-left and (x1,y1) in the bottom-right width = (x1 - x0) canvas.create_rectangle(x0, y0, x0+width/3, y1, fill="black", width=0) canvas.create_rectangle(x0+width/3, y0, x0+width*2/3, y1, fill="yellow", width=0) canvas.create_rectangle(x0+width*2/3, y0, x1, y1, fill="red", width=0) def draw(canvas, width, height): # Draw a large Belgian flag drawBelgianFlag(canvas, 25, 25, 175, 150) # And draw a smaller one below it drawBelgianFlag(canvas, 75, 160, 125, 200) # Now let's have some fun and draw a whole grid of Belgian flags! flagWidth = 30 flagHeight = 25 margin = 5 for row in range(4): for col in range(6): left = 200 + col * flagWidth + margin top = 50 + row * flagHeight + margin right = left + flagWidth - margin bottom = top + flagHeight - margin drawBelgianFlag(canvas, left, top, right, bottom)Result:
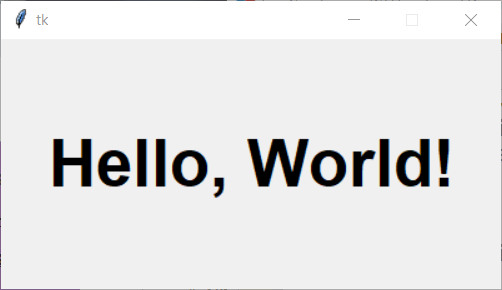
- Resizing text
def draw(canvas, width, height): # Resizing text is harder, but possible! # Just compute the font size based on the width or height # Some guesswork helps to get the ratio right textSize = width // 10 canvas.create_text(width/2, height/2, text="Hello, World!", font="Arial " + str(textSize) + " bold")Result:
- Check 2.7
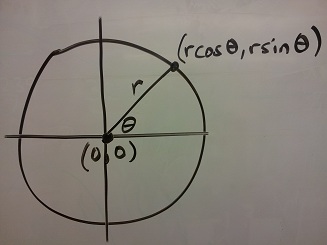
- Drawing Circular Patterns with Trigonometry
Trig 101
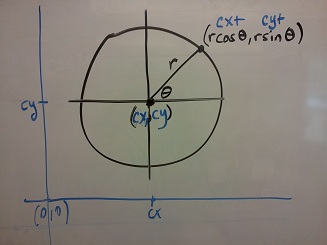
- Circle centered at origin
- Circle centered at (cx, cy)
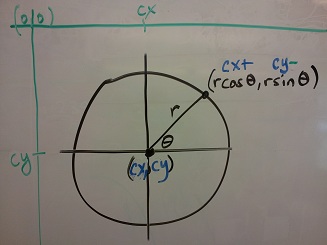
- Circle centered at (cx, cy) in Python graphics ("up is down!")
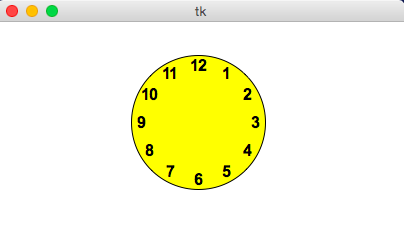
Example:import math def draw(canvas, width, height): (cx, cy, r) = (width/2, height/2, min(width, height)/3) canvas.create_oval(cx-r, cy-r, cx+r, cy+r, fill="yellow") r *= 0.85 # make smaller so time labels lie inside clock face for hour in range(12): hourAngle = math.pi/2 - (2*math.pi)*(hour/12) hourX = cx + r * math.cos(hourAngle) hourY = cy - r * math.sin(hourAngle) label = str(hour if (hour > 0) else 12) canvas.create_text(hourX, hourY, text=label, font="Arial 16 bold")Result:
- Circle centered at origin
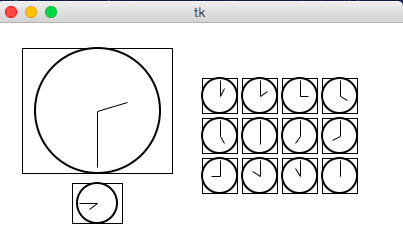
- Example: Clocks!
import math def drawClock(canvas, x0, y0, x1, y1, hour, minute): # draw a clock in the area bounded by (x0,y0) in # the top-left and (x1,y1) in the bottom-right # with the given time # draw an outline rectangle canvas.create_rectangle(x0, y0, x1, y1, outline="black", width=1) # find relevant values for positioning clock width = (x1 - x0) height = (y1 - y0) r = min(width, height)/2 cx = (x0 + x1)/2 cy = (y0 + y1)/2 # draw the clock face canvas.create_oval(cx-r, cy-r, cx+r, cy+r, outline="black", width=2) # adjust the hour to take the minutes into account hour += minute/60.0 # find the hourAngle and draw the hour hand # but we must adjust because 0 is vertical and # it proceeds clockwise, not counter-clockwise! hourAngle = math.pi/2 - 2*math.pi*hour/12 hourRadius = r*1/2 hourX = cx + hourRadius * math.cos(hourAngle) hourY = cy - hourRadius * math.sin(hourAngle) canvas.create_line(cx, cy, hourX, hourY, fill="black", width=1) # repeat with the minuteAngle for the minuteHand minuteAngle = math.pi/2 - 2*math.pi*minute/60 minuteRadius = r*9/10 minuteX = cx + minuteRadius * math.cos(minuteAngle) minuteY = cy - minuteRadius * math.sin(minuteAngle) canvas.create_line(cx, cy, minuteX, minuteY, fill="black", width=1) def draw(canvas, width, height): # Draw a large clock showing 2:30 drawClock(canvas, 25, 25, 175, 150, 2, 30) # And draw a smaller one below it showing 7:45 drawClock(canvas, 75, 160, 125, 200, 7, 45) # Now let's have some fun and draw a whole grid of clocks! width = 40 height = 40 margin = 5 hour = 0 for row in range(3): for col in range(4): left = 200 + col * width + margin top = 50 + row * height + margin right = left + width - margin bottom = top + height - margin hour += 1 drawClock(canvas, left, top, right, bottom, hour, 0)Result: